Tech Pick of the Week: Log anomaly detection tools
An important part of creating successful digital services is the ability to monitor system’s health and to respond to exceptional situations in a timely fashion. Log files contain information that a maintainer needs in figuring out causes for application failures or unexpected behavior.
However, it is often difficult for a human to identify the explanations even if all the necessary information is in principle available in the logs because today’s applications are so complex and consist of several interconnected software components. Luckily there are tools that can help. IT operation analytics is a field that uses statistical and data mining techniques to let computers do the hard work of detecting and analysing important events in the application logs. Mining insights from logs leads to better and more maintainable software.
Anomaly detection spots unexpected patterns in logs
On this blog post, I focus on one particular kind of tool: log anomaly detection. An anomaly detection software monitors logs for unexpected patterns and alerts the maintainer if something abnormal is detected. The anomaly detectors use statistical methods to analyze the logs so that there is no need for a maintainer to define what is considered normal behavior in advance. Instead, the tool learns patterns of what kind of log messages typically appear under normal conditions. It then continues to track incoming log messages and alerts the maintainer if something unexpected is detected. An anomaly detection algorithm can track either numerical values extracted from the logs or frequencies of log messages. Equipped with the exact knowledge of what is abnormal in the logs, the maintainer can then hopefully track down the reason for the anomaly easily.
The usual approach without automatic tools is to identify a set of measures to track and to write down scripts that send alerts when an observed value exceed a static threshold. For example, an alert could be set to fire if the amount of incoming traffic per hour on a site is larger than a predefined value as in the figure below.
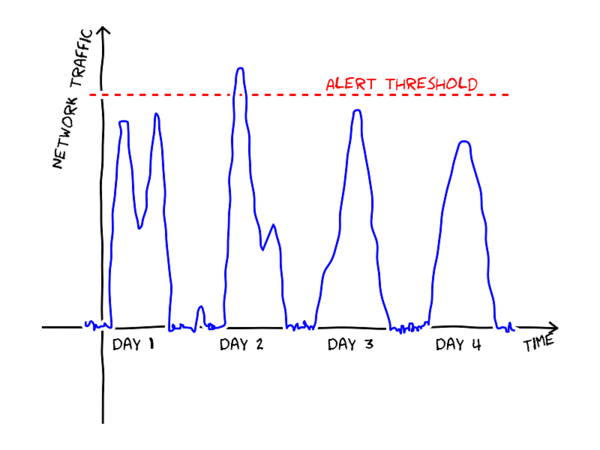
Static thresholds, however, are difficult to calibrate. If the threshold is set too low, false alerts will be generated (perhaps the peak on day 2 in the figure is completely normal operation?). If, on the other hand, the threshold is too high, not all abnormal events are detected. A static threshold also fails to notice the strange slump in the middle of day 1.
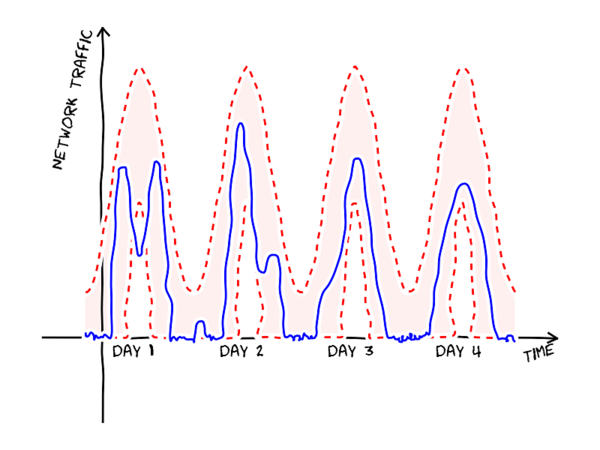
Anomaly detection automatically learns a baseline, or a typical pattern of events, by inspecting the logs, and is able to infer dynamic thresholds. A simplified example of dynamic thresholds is shown in the figure below. The shaded band between the red lines shows the region where the values are expected to land. Now, the day 1 slump crosses the lower threshold and is thus detected. In fact, an anomaly detection model can be even more flexible than the figure shows. Instead of fixed thresholds, a model can estimate the probability of each new observation given the similar situations in the past, and raise an alert if the new observation is very unlikely.
Another benefit of automatic anomaly detection is that it is possible to find unexpected events, whereas matching against pre-written rules is only ever able to find things the developer anticipated (the developer has not been able to write detection rules for unanticipated events!). At its best, an anomaly detection algorithm might even notice unexpected changes before a serious problem develops.
Experiment: Processing logs with Prelert Anomaly Detective
I experimented with a program called Prelert Anomaly Detective by using it to process logs of a project. It uses machine learning methods to identify anomalies in the logs in real-time. Prelert is not the only tool for the task; Sumo Logic and Google Analytics Intelligence Events are some of the other tools capable of detecting unexpected patterns in logs.
There are several options for getting the log files into Prelert. One can manually upload logs or set up a scheduled task to download logs from a remote server. Prelert automatically detects timestamps, and can summarize data by grouping similar log messages together. A developer can also ask Prelert to extract numerical or textual values from log messages for further analysis. Prelert helps in this task by constructing regular expressions from examples.
After the parsing is finished, one can tell Prelert to analyse the logs and to learn a baseline. As far as I can tell (there is not much documentation available), Prelert’s baseline consists of a mean value and typical variation in a time window. Prelert’s main task is detecting large deviations that do not fit in the learned baseline (e.g. fewer than expected of certain kind of log messages). Prelert computes an “anomaly score”, which is an abstract measure of the magnitude of the deviation at the given time window. The anomaly score is plotted on a timeline to visualize when potential anomalies have occurred. The detection can be done as an ad-hoc analysis on historical data or in real-time as more logs come in. In the latter mode, the system sends emails to the maintainer as soon as deviations happen.
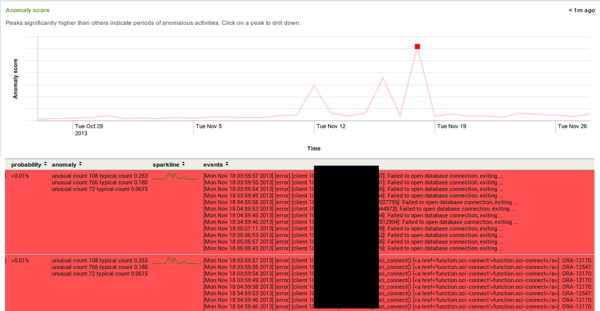
The figure above shows Prelert’s anomaly timeline for back-end server logs. There are three clear peaks between November 12 and 18 showing that something unexpected has happened. The red lines below the graph show log lines with the largest deviations from the expected during the selected point in time (i.e. the log messages that are the reason for the deviation). All of the lines are related to database connection errors, and, indeed, during the time in question there was a problem with the database that caused connection failures under a heavy load.
Challenges and conclusions
There are some challenges in using automated log analysis methods. An important issue is reliability: can one trust that the program has detected all the important events? Secondly, although anomaly detection tools automate some parts of the log analysis, manual work and understanding of the system is still required in setting up and understanding the detected anomalies.
Anomaly detection is just one of the interesting statistical methods that can help a maintainer. Intrusion and fraud detection use similar techniques to discover possible security breaches or otherwise suspicious user behavior from the logs. Predictive analytics predicts how a system will behave in the future, and can forecast, for example, the need to allocate more hard drive space before the current capacity is exceeded. Root cause analysis tries to pinpoint which software component is responsible for causing a failure.
The anomaly detection tools can help developers to understand application behavior by making sense of application logs. Automatic learning of baselines and detection of unusual deviations aim to decrease maintainer’s workload in monitoring logs. The ability to react to abnormal conditions faster, even before they cause failures, leads to more resilient software. Overall, the anomaly detection and other log analysis methods seem great tools for finding bugs and other error conditions with a small effort. This will eventually lead to higher quality software.
More to explore
 Antti AjankiLead Data Scientist

